Want to get more consistent, confident exposures—no matter how your screen looks? Learn to read a histogram.
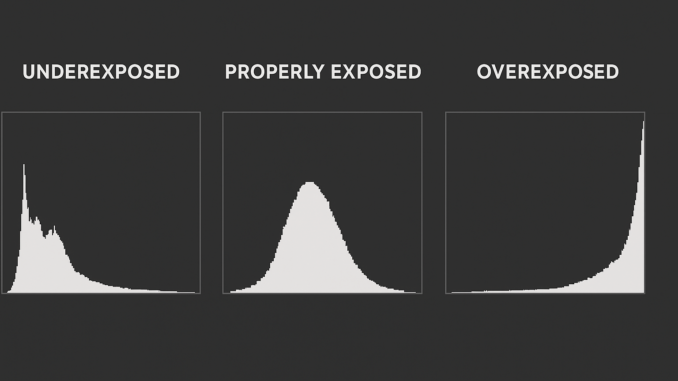
A histogram is a graph that shows how light is distributed in your photo. The left side of the graph shows shadows in your image, or dark areas. The right side of the graph shows highlights or white areas. The middle part of the graph reflects the mid-tones. A well-exposed image generally has data spread across the whole graph—but not always centered.
To turn on your histogram, check your camera’s playback or live view display settings. On most DSLRs and mirrorless cameras, it’ll be listed under “Display Options” or “Info Overlays.” Once enabled, a histogram will appear alongside your image when you review or compose a shot.
Reading the histogram helps you shoot with intention and edit with clarity—no guesswork needed.
Quick Tips:
- A spike on the left? You may be underexposed — blacks are crushed, losing shadow detail.
- A spike on the right? Could be overexposed — highlights are blown out, with no recoverable detail.
- Clipping means you’ve lost all detail in the brightest or darkest areas — pure black or pure white. The histogram will be touching the edge when that happens.
- Don’t fear a little clipping—just be intentional about where it happens. Losing detail in a background highlight might be okay; in a face, probably not.
- Use the histogram in bright sun when your LCD screen can’t be trusted.
Challenge: Turn on your histogram this week. Try shooting three versions of the same scene: underexposed, overexposed, and balanced. Study how the graph shifts — and how it affects the look and feel of your photo.
